
Is your computer feeling sluggish? Wondering if your processor is sweating under load? It’s time to peek under the hood and see what your CPU is actually doing. Whether you’re a hardcore gamer trying to squeeze every frame out of your setup, someone running heavy workloads, or just curious about what’s hogging your processor, we’ve got you covered.
This guide walks you through several methods to track CPU activity, from the super simple to the beautifully detailed. Let’s dive in!
Understanding CPU Usage Basics
Before you start monitoring, there’s something important to understand about those percentage numbers you’re about to see. CPU usage typically shows as a single percentage. Sounds straightforward, right? Well, there’s a twist.
Modern processors don’t have just one core anymore. Most have multiple cores working together. Here’s where it gets interesting: imagine you’ve got a four-core CPU, and one core is running flat out at 100% while the other three are barely doing anything. Many monitoring tools will show roughly 25% overall CPU usage, since the total is calculated as an average across all cores.
However, different tools and operating systems can define “total CPU usage” slightly differently, so treat these percentages as an approximate health check rather than a precise formula. The important thing to know: that single maxed-out core becomes your bottleneck, and your actual performance suffers. This is super common in games that haven’t been optimized for multiple cores.
That’s why some of the tools we’re about to explore let you see what each individual core is up to. This granular view helps you spot the real performance culprits.
How to Check CPU Usage with Task Manager?
Let’s start with the simplest option, and honestly, for most people, this is all you’ll ever need. Windows comes built-in with a solid performance monitoring tool, and it just keeps getting better with each update. Here’s how to use it in Windows 10 and Windows 11:
- Open Task Manager: The fastest way is hitting the keyboard shortcut: Ctrl + Shift + Escape. Done. Task Manager is now open.
- Navigate to the Performance Tab: You’ll see several tabs at the top of the Task Manager window. Click on the “Performance” tab. Once there, look for and click on “CPU” in the left sidebar. Now you’re looking at your processor’s performance dashboard.
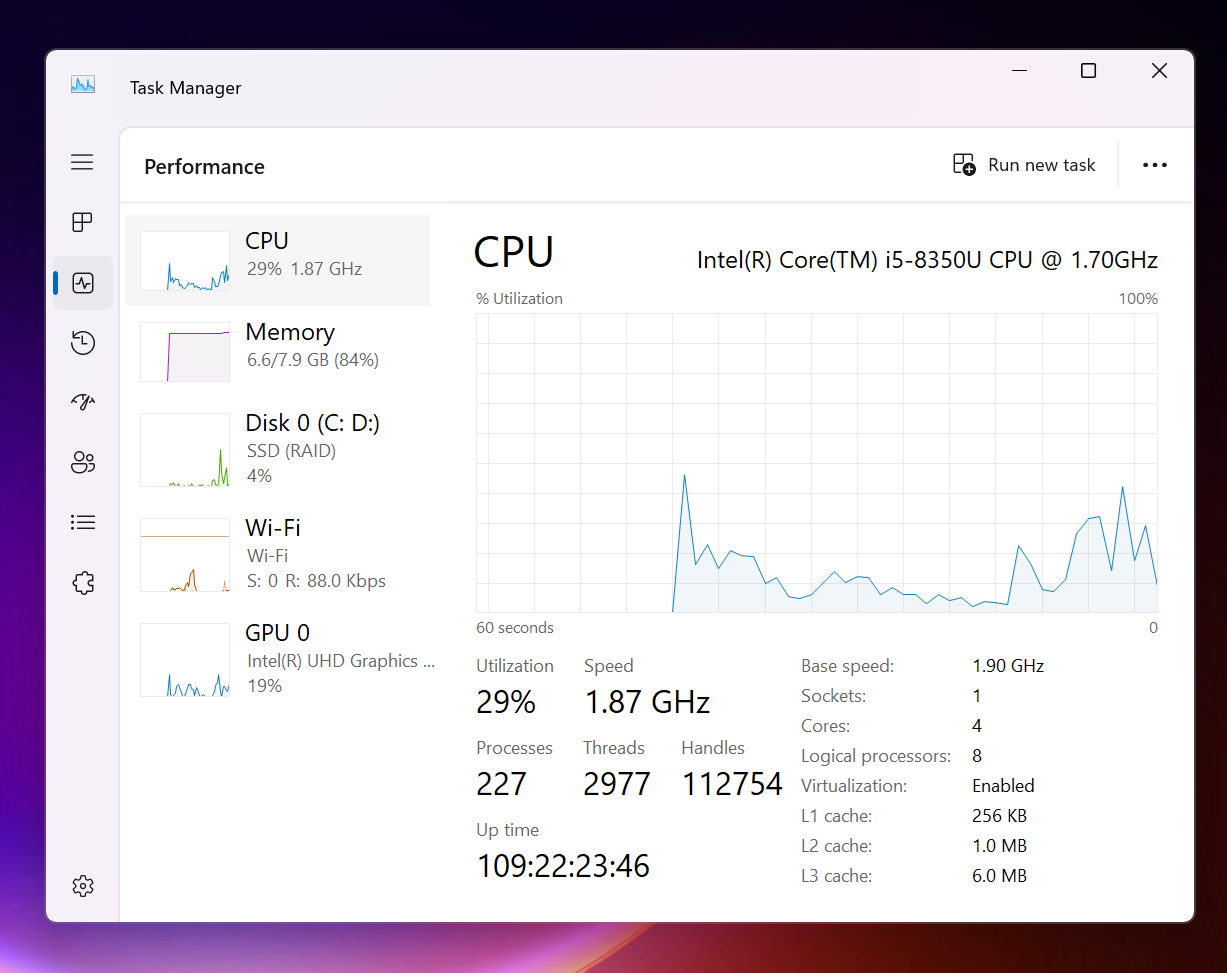
You’ll see a colorful graph that shows your CPU usage percentage over time. This graph gives you a quick visual sense of whether your processor is relaxed or working overtime. If this simple percentage view is all you needed, you’re done here.
If you want to see what each individual core is doing, right-click directly on the performance graph. A small menu will pop up. Select “Change Graph to” and then choose “Logical Processors.”
What does “logical processor” mean? Well, your CPU might have 8 physical cores, but if each core supports hyperthreading (Intel’s technology that lets one core handle two tasks simultaneously), Windows recognizes 16 logical processors. That’s the number Windows reports and may display in this view.
With this view active, you’ll see a grid of small graphs, each representing one logical processor. This is your chance to see if the workload is distributed evenly across all processors or if one thread is hogging all the resources while others are chilling out. An uneven distribution might explain why your game feels sluggish even though overall CPU usage seems low.
Pro Tip: Check back on these graphs periodically when your computer feels slow. You might spot patterns that reveal which app is causing trouble.
How to Check CPU Usage with Xbox Game Bar?
Here’s a problem: Task Manager is great, but it doesn’t work well if you’re running a full-screen game or application. Sure, you could exit the game to check Task Manager, but that defeats the purpose of real-time monitoring. That’s where Xbox Game Bar comes in.
Yes, it’s called “Xbox” Game Bar, but don’t let that fool you, it works for any full-screen application on Windows 10 and Windows 11. On most systems, this nifty overlay lets you pin a performance widget right on top of your full-screen app.
Note: On some Windows 11 configurations, Game Bar may need to be enabled once in Windows Settings.
- Launch Xbox Game Bar: Press Win + G on your keyboard. You’ll see the Game Bar pop up on your screen.
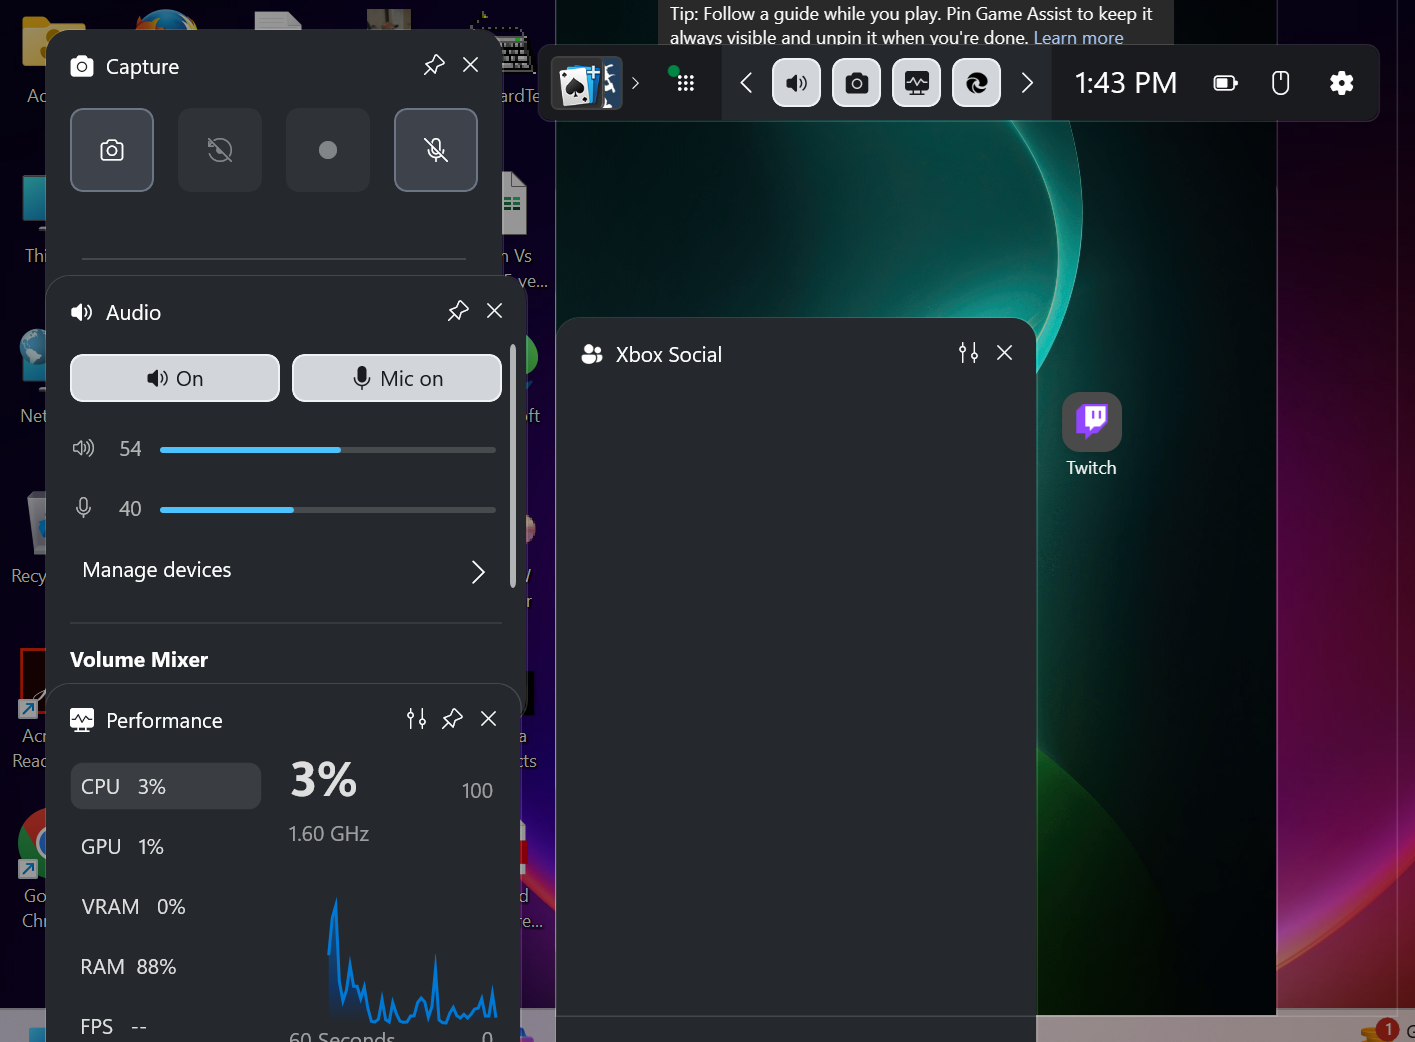
- Position the Performance Widget: The Game Bar includes a performance widget that shows CPU, GPU, RAM, and frame rate information. If it’s not visible, look for it in the widgets menu. Once you see it, you can drag it to any spot on your screen using your mouse. Place it somewhere that won’t block important game elements.
- Pin the Widget: See that little pin icon on the performance widget? Click it. This locks the widget in place, so it’ll stay visible even after you close the Game Bar.
- Close the Game Bar: Press Win + G again to close the Game Bar. Your pinned performance widget remains on screen, floating above your game or app, showing you real-time CPU usage.
How to Check CPU Usage with MSI Afterburner + RTSS?
Want the most comprehensive on-screen monitoring while gaming? MSI Afterburner combined with Riva Tuner Statistics Server (RTSS) is your answer. This setup can show you detailed CPU usage per logical processor, depending on your configuration and system data sources. Fair warning: setup takes a few extra minutes, but it’s worth it if you’re serious about optimization.
- Download and Install MSI Afterburner: Head over to MSI’s official website and grab MSI Afterburner. Download the installer, unzip it, and run the installation. During setup, you’ll see a checkbox for installing RTSS, don’t uncheck it. This component is essential for the overlay to work.
- Launch MSI Afterburner: Open the application. Windows will ask you to grant special privileges, click “Yes” to proceed. This is necessary for the app to access detailed system information.
- Open Settings: Look for a gear/cog icon (settings button) and click it. This opens the MSI Afterburner properties window where all the magic happens.
- Go to the Monitoring Tab: In the properties window, you’ll see multiple tabs. Click on “Monitoring.” This section lists all the different metrics your system can track, CPU, GPU, memory, temperatures, and more.
- Enable CPU Usage Monitoring: Under “Active hardware monitoring graphs,” you’ll see multiple entries for “CPU Usage” typically one for each logical processor on your system. For instance, if you have a 10-core processor with hyperthreading, you’ll see 20 CPU Usage entries. Check the box next to each one you want to monitor. Yes, checking all of them is fine and actually recommended.
- Select All CPU Entries: Now, hold down the Shift key and click each CPU usage entry to select them all. This makes the next step faster.
- Enable On-Screen Display: With all the CPU entries selected, look for a button labeled “Show in on-screen display” and click it. This ensures all your monitored CPU information appears in the overlay while you’re gaming.
- Set a Keyboard Shortcut: Still in the settings window, click on the “On-screen Display” tab. Here you can set a keyboard shortcut to toggle the overlay on and off. The default is the Home key, but you can change it to whatever you prefer. (We recommend something like Shift + P for easy access.) Set your preference and remember it.
- Test It Out: Click OK to save your settings. Now launch your favorite game or 3D application. Press your custom shortcut key, and the detailed CPU overlay should appear in the corner of your screen, displaying usage for each individual logical processor. If nothing shows up, make sure MSI Afterburner is running in the background.
How to Check CPU Usage with HWInfo64?
All the methods above show you real-time CPU usage, which is great for spotting immediate problems. But sometimes you want to see the bigger picture, like whether your CPU spikes at certain times of day, or which specific applications cause stress over a longer period. That’s where HWInfo64 comes in. This free utility is like a flight recorder for your system, logging every detail so you can review it later.
- Download and Install HWInfo64: Visit the official HWInfo website and download the application. You can either install it or grab the portable version if you prefer not to install anything. Both work equally well.
- Start Logging: Run HWInfo64. The application will scan your system, this takes a minute or so. Once it’s done initializing, look for a “Start” button and click it.
- Access Sensor Status: In the menu bar, go to “Monitoring” and then select “Sensor Status.” This window displays all the sensors on your system and the data they’re collecting, including CPU metrics.
- Identify and Select Total CPU Usage: In the sensor list, find the entry called “Total CPU Usage.” This is the metric you want to track. Make sure it’s selected, you may need to check a checkbox next to it or select it from a list, depending on your HWInfo64 version. (Some versions allow you to choose “Log All Sensors” or “Log Selected Sensors.”) You can hover your mouse over any sensor to see a tooltip explaining what it measures.
- Start Your Log: Look for the “Start Logging” button and click it. A dialog box appears asking where you’d like to save the log file. HWInfo64 saves everything as a CSV file, which you can open in Excel, Google Sheets, or any spreadsheet application. Choose a location you’ll remember.
- Let It Run: Now just go about your business. Run your games, applications, or whatever workload you want to analyze. HWInfo64 quietly logs everything in the background. It records timestamps, CPU usage percentage, and per-core information.
- Stop Logging: When you’re done gathering data, return to HWInfo64’s sensor status window and click the “Stop Logging” button.
- Review Your Data: Open the CSV file you saved earlier with your spreadsheet application. You’ll see columns for date, time, and various CPU metrics. Compare the timestamp column with the “Total CPU Usage” column to spot when your system was under stress. Were there specific times when usage spiked? Which applications were running? This detective work helps identify problematic software or usage patterns.
What CPU Usage Tells You, and What It Doesn’t
Now that you know how to monitor CPU usage, here’s something important: these numbers don’t tell the whole story. A low CPU usage percentage doesn’t mean your processor is happy, it just means it’s not busy. A game running at 30 frames per second with only 40% CPU usage might be GPU-bottlenecked instead. Conversely, 100% CPU usage on a single thread while other threads are idle means you’ve found a bottleneck that’s holding back your entire system.
The sweet spot? Generally, you want CPU usage to be reasonable (not constantly maxed out) and distributed evenly across your cores when you’re running multi-threaded applications. Single-threaded apps will naturally max out one core, and that’s okay, it’s a limitation of the software, not your hardware.
FAQs
Your CPU hits 100% when every available core is fully busy running processes at once, usually because one or more apps, system tasks, or background services are using maximum processing power. This can happen during heavy‑duty work like gaming, video rendering, antivirus scans, or when a program is stuck in a loop or misbehaving.
Press Ctrl + Shift + Esc to open Task Manager, go to the Processes tab, and sort the CPU column (click the “CPU” header). The top‑listed processes are using the most CPU; you can end an unneeded or misbehaving one by selecting it and clicking End task.
Open Task Manager with Ctrl + Shift + Esc, switch to the Performance tab, click CPU, then right‑click the CPU graph and choose Change graph to → Logical processors to see usage for each core.
For CPU health, use Task Manager’s Performance → CPU tab to watch usage, temperature (if supported via third‑party tools like HWiNFO), and stability during heavy‑load tests such as Prime‑95. For RAM health, run Windows Memory Diagnostic (search “Windows Memory Diagnostic” → schedule a restart test) or a tool like MemTest86 from a bootable USB to detect memory errors.